Portfolio Optimization with R
According to the Modern portfolio theory (MPT) for any given level of risk it is possible to maximize the return of a portfolio, which is in practice called portfolio optimization. To do this oone would need the historical prices of the assets that will be used to compute mean returns for the time period, as well as the covariance matrix between the assets for the same period, and finally random weights assigned to each asset and to maximize the return to risk ratio.
First you have to install and load the following packages:
library(tidyquant)
library(timetk)
library(forcats)
library(tidyr)
library(kableExtra)
library(ggplot2)
library(dplyr)
Sector etfs
This analysis is based on sector ETFs to gain a perspective on the performance and risk of different sectors. IXC energy sector, IXG financial sector, IXN technology sector, IXJ healthcare sector, IXP telecom sector, RXI consumer discretionary sector, EXI industrial sector, MXI basic sector, KXI consumer staple sector, and forJXI utlities sector. Here we use the tq_get function.
tick <- c('IXC', 'IXG', 'IXN', 'IXJ', 'IXP','RXI','EXI','MXI','KXI','JXI')

price_data <- tq_get(tick,
                     from = '2010-01-01',
                     to = '2021-11-01',
                     get = 'stock.prices')
as always we transform the price to return and log transform it using tq_transmute function
log_ret_tidy <- price_data %>%
  dplyr::group_by(symbol) %>%
  tq_transmute(select = adjusted,
               mutate_fun = periodReturn,
               period = 'daily',
               col_rename = 'ret',
               type = 'log')

head(log_ret_tidy)%>%kable()
| symbol | date | ret |
|---|---|---|
| IXC | 2010-01-04 | 0.0000000 |
| IXC | 2010-01-05 | 0.0054231 |
| IXC | 2010-01-06 | 0.0086161 |
| IXC | 2010-01-07 | -0.0029534 |
| IXC | 2010-01-08 | 0.0037575 |
| IXC | 2010-01-11 | 0.0074727 |
then we transform the long data to wide data using the spread function and drop the missing data using the drop_na function.
log_ret_xts <- log_ret_tidy %>%
  spread(symbol, value = ret) %>%
  tk_xts()
## Warning: Non-numeric columns being dropped: date
## Using column `date` for date_var.
log_ret_xts=log_ret_xts%>%as.data.frame()%>%drop_na()

summary(log_ret_xts)%>%kable()
| EXI | IXC | IXG | IXJ | IXN | IXP | JXI | KXI | MXI | RXI | |
|---|---|---|---|---|---|---|---|---|---|---|
| Min. :-0.1079408 | Min. :-2.163e-01 | Min. :-0.1415391 | Min. :-0.0979635 | Min. :-0.1537118 | Min. :-0.1025307 | Min. :-0.1241903 | Min. :-0.0967470 | Min. :-0.1191473 | Min. :-0.1300503 | |
| 1st Qu.:-0.0046489 | 1st Qu.:-6.889e-03 | 1st Qu.:-0.0055047 | 1st Qu.:-0.0040270 | 1st Qu.:-0.0048440 | 1st Qu.:-0.0046377 | 1st Qu.:-0.0044924 | 1st Qu.:-0.0034824 | 1st Qu.:-0.0061805 | 1st Qu.:-0.0044866 | |
| Median : 0.0009071 | Median : 4.926e-04 | Median : 0.0008703 | Median : 0.0008421 | Median : 0.0012534 | Median : 0.0006725 | Median : 0.0007154 | Median : 0.0005264 | Median : 0.0003481 | Median : 0.0009753 | |
| Mean : 0.0004047 | Mean : 4.899e-05 | Mean : 0.0002916 | Mean : 0.0004754 | Mean : 0.0006594 | Mean : 0.0003062 | Mean : 0.0002286 | Mean : 0.0003485 | Mean : 0.0001967 | Mean : 0.0005240 | |
| 3rd Qu.: 0.0062073 | 3rd Qu.: 7.699e-03 | 3rd Qu.: 0.0068296 | 3rd Qu.: 0.0056683 | 3rd Qu.: 0.0069806 | 3rd Qu.: 0.0056638 | 3rd Qu.: 0.0055806 | 3rd Qu.: 0.0047739 | 3rd Qu.: 0.0072199 | 3rd Qu.: 0.0064221 | |
| Max. : 0.0990035 | Max. : 1.597e-01 | Max. : 0.1066680 | Max. : 0.0668417 | Max. : 0.1050387 | Max. : 0.0709797 | Max. : 0.1014732 | Max. : 0.0786298 | Max. : 0.1034600 | Max. : 0.0961797 |
head(log_ret_xts)%>%kable()
| EXI | IXC | IXG | IXJ | IXN | IXP | JXI | KXI | MXI | RXI | |
|---|---|---|---|---|---|---|---|---|---|---|
| 2010-01-04 | 0.0000000 | 0.0000000 | 0.0000000 | 0.0000000 | 0.0000000 | 0.0000000 | 0.0000000 | 0.0000000 | 0.0000000 | 0.0000000 |
| 2010-01-05 | 0.0017576 | 0.0054231 | 0.0123934 | -0.0089702 | 0.0017488 | -0.0019752 | -0.0024789 | -0.0106712 | 0.0021808 | 0.0022542 |
| 2010-01-06 | 0.0021924 | 0.0086161 | 0.0023331 | 0.0034450 | -0.0071896 | -0.0104807 | 0.0028915 | -0.0003517 | 0.0175849 | 0.0004501 |
| 2010-01-07 | 0.0074191 | -0.0029534 | 0.0038065 | -0.0030617 | -0.0026436 | -0.0102250 | -0.0076597 | -0.0035249 | -0.0045976 | 0.0049393 |
| 2010-01-08 | 0.0121002 | 0.0037575 | 0.0084070 | 0.0049704 | 0.0080843 | 0.0012839 | 0.0051818 | 0.0001765 | 0.0100872 | 0.0080304 |
| 2010-01-11 | 0.0123799 | 0.0074727 | -0.0002095 | 0.0091116 | -0.0031557 | 0.0016483 | 0.0115111 | 0.0056329 | 0.0053080 | 0.0042126 |
using the long data colMeans function provides the mean daily return for each sector
mean_ret <- colMeans(log_ret_xts,na.rm = T)
print(round(mean_ret, 5))%>%kable()
##     EXI     IXC     IXG     IXJ     IXN     IXP     JXI     KXI     MXI     RXI
## 0.00040 0.00005 0.00029 0.00048 0.00066 0.00031 0.00023 0.00035 0.00020 0.00052
| x | |
|---|---|
| EXI | 0.00040 |
| IXC | 0.00005 |
| IXG | 0.00029 |
| IXJ | 0.00048 |
| IXN | 0.00066 |
| IXP | 0.00031 |
| JXI | 0.00023 |
| KXI | 0.00035 |
| MXI | 0.00020 |
| RXI | 0.00052 |
in the same way the daily covariance matrix is formed by the cov function and multiplied by the number of work days per year i.e. 252 days excluding weekends and holidays.
cov_mat <- cov(log_ret_xts) * 252
print(round(cov_mat,4))%>%kable()
##        EXI    IXC    IXG    IXJ    IXN    IXP    JXI    KXI    MXI    RXI
## EXI 0.0365 0.0397 0.0390 0.0245 0.0322 0.0254 0.0239 0.0202 0.0379 0.0321
## IXC 0.0397 0.0679 0.0468 0.0267 0.0353 0.0296 0.0269 0.0224 0.0465 0.0355
## IXG 0.0390 0.0468 0.0492 0.0275 0.0358 0.0293 0.0273 0.0224 0.0427 0.0359
## IXJ 0.0245 0.0267 0.0275 0.0251 0.0260 0.0205 0.0197 0.0171 0.0263 0.0237
## IXN 0.0322 0.0353 0.0358 0.0260 0.0418 0.0277 0.0227 0.0207 0.0355 0.0327
## IXP 0.0254 0.0296 0.0293 0.0205 0.0277 0.0271 0.0205 0.0175 0.0285 0.0256
## JXI 0.0239 0.0269 0.0273 0.0197 0.0227 0.0205 0.0282 0.0185 0.0258 0.0222
## KXI 0.0202 0.0224 0.0224 0.0171 0.0207 0.0175 0.0185 0.0193 0.0219 0.0193
## MXI 0.0379 0.0465 0.0427 0.0263 0.0355 0.0285 0.0258 0.0219 0.0481 0.0345
## RXI 0.0321 0.0355 0.0359 0.0237 0.0327 0.0256 0.0222 0.0193 0.0345 0.0339
| EXI | IXC | IXG | IXJ | IXN | IXP | JXI | KXI | MXI | RXI | |
|---|---|---|---|---|---|---|---|---|---|---|
| EXI | 0.0365 | 0.0397 | 0.0390 | 0.0245 | 0.0322 | 0.0254 | 0.0239 | 0.0202 | 0.0379 | 0.0321 |
| IXC | 0.0397 | 0.0679 | 0.0468 | 0.0267 | 0.0353 | 0.0296 | 0.0269 | 0.0224 | 0.0465 | 0.0355 |
| IXG | 0.0390 | 0.0468 | 0.0492 | 0.0275 | 0.0358 | 0.0293 | 0.0273 | 0.0224 | 0.0427 | 0.0359 |
| IXJ | 0.0245 | 0.0267 | 0.0275 | 0.0251 | 0.0260 | 0.0205 | 0.0197 | 0.0171 | 0.0263 | 0.0237 |
| IXN | 0.0322 | 0.0353 | 0.0358 | 0.0260 | 0.0418 | 0.0277 | 0.0227 | 0.0207 | 0.0355 | 0.0327 |
| IXP | 0.0254 | 0.0296 | 0.0293 | 0.0205 | 0.0277 | 0.0271 | 0.0205 | 0.0175 | 0.0285 | 0.0256 |
| JXI | 0.0239 | 0.0269 | 0.0273 | 0.0197 | 0.0227 | 0.0205 | 0.0282 | 0.0185 | 0.0258 | 0.0222 |
| KXI | 0.0202 | 0.0224 | 0.0224 | 0.0171 | 0.0207 | 0.0175 | 0.0185 | 0.0193 | 0.0219 | 0.0193 |
| MXI | 0.0379 | 0.0465 | 0.0427 | 0.0263 | 0.0355 | 0.0285 | 0.0258 | 0.0219 | 0.0481 | 0.0345 |
| RXI | 0.0321 | 0.0355 | 0.0359 | 0.0237 | 0.0327 | 0.0256 | 0.0222 | 0.0193 | 0.0345 | 0.0339 |
The runif function provides hypothetical weights standardized to sum up to 1.
wts <- runif(n = length(tick))
wts <- wts/sum(wts)
print(wts)%>%kable()
##  [1] 0.02181918 0.07788497 0.05416218 0.21472448 0.06099253 0.04694185
##  [7] 0.19240680 0.15534889 0.07119757 0.10452155
| x |
|---|
| 0.0218192 |
| 0.0778850 |
| 0.0541622 |
| 0.2147245 |
| 0.0609925 |
| 0.0469418 |
| 0.1924068 |
| 0.1553489 |
| 0.0711976 |
| 0.1045216 |
This is the code for computing portfolio returns, risks, and sharp ratios.
port_returns <- (sum(wts * mean_ret) + 1)^252 - 1


port_risk <- sqrt(t(wts) %*%(cov_mat %*% wts) )
print(port_risk)%>%kable()
##          [,1]
## [1,] 0.158721
| 0.158721 |
sharpe_ratio <- port_returns/port_risk
print(sharpe_ratio)%>%kable()
##           [,1]
## [1,] 0.5842914
| 0.5842914 |
This snippet set place holders for 10000 weights, portfolio risks, returns, and sharp ratios.
num_port <- 10000

# Creating a matrix to store the weights

all_wts <- matrix(nrow = num_port,
                  ncol = length(tick))

# Creating an empty vector to store
# Portfolio returns

port_returns <- vector('numeric', length = num_port)

# Creating an empty vector to store
# Portfolio Standard deviation

port_risk <- vector('numeric', length = num_port)

# Creating an empty vector to store
# Portfolio Sharpe Ratio

sharpe_ratio <- vector('numeric', length = num_port)
here is the loop to highlight portfolio returns, risks, and sharp ratios for different wheight combinations
for (i in seq_along(port_returns)) {

  wts <- runif(length(tick))
  wts <- wts/sum(wts)

  # Storing weight in the matrix
  all_wts[i,] <- wts

  # Portfolio returns

  port_ret <- sum(wts * mean_ret)
  port_ret <- ((port_ret + 1)^252) - 1

  # Storing Portfolio Returns values
  port_returns[i] <- port_ret


  # Creating and storing portfolio risk
  port_sd <- sqrt(t(wts) %*% (cov_mat  %*% wts))
  port_risk[i] <- port_sd

  # Creating and storing Portfolio Sharpe Ratios
  # Assuming 0% Risk free rate

  sr <- port_ret/port_sd
  sharpe_ratio[i] <- sr

}
here we are making a tibble of portfolio returns, risks, and sharp ratios
portfolio_values <- tibble(Return = port_returns,
                           Risk = port_risk,
                           SharpeRatio = sharpe_ratio)


# Converting matrix to a tibble and changing column names
all_wts <- tk_tbl(all_wts)
## Warning in tk_tbl.data.frame(as.data.frame(data), preserve_index,
## rename_index, : Warning: No index to preserve. Object otherwise converted to
## tibble successfully.
colnames(all_wts) <- colnames(log_ret_xts)

# Combing all the values together
portfolio_values <- tk_tbl(cbind(all_wts, portfolio_values))
## Warning in tk_tbl.data.frame(cbind(all_wts, portfolio_values)): Warning: No
## index to preserve. Object otherwise converted to tibble successfully.
head(portfolio_values)%>%kable()
| EXI | IXC | IXG | IXJ | IXN | IXP | JXI | KXI | MXI | RXI | Return | Risk | SharpeRatio |
|---|---|---|---|---|---|---|---|---|---|---|---|---|
| 0.0015059 | 0.1415284 | 0.1188994 | 0.1288394 | 0.0145800 | 0.1913636 | 0.1803470 | 0.0978158 | 0.0370134 | 0.0881072 | 0.0786358 | 0.1649985 | 0.4765849 |
| 0.1486655 | 0.0318730 | 0.0683066 | 0.0787044 | 0.1056284 | 0.0336204 | 0.1851120 | 0.1775181 | 0.0860809 | 0.0844906 | 0.0961518 | 0.1626657 | 0.5911005 |
| 0.0671929 | 0.1721032 | 0.0626337 | 0.0954884 | 0.1794551 | 0.0124373 | 0.0973874 | 0.1729593 | 0.0886350 | 0.0517077 | 0.0917700 | 0.1720987 | 0.5332403 |
| 0.1399838 | 0.0752763 | 0.0430130 | 0.0601343 | 0.0910031 | 0.1037290 | 0.1257542 | 0.0925847 | 0.1396637 | 0.1288578 | 0.0919778 | 0.1701907 | 0.5404394 |
| 0.1707087 | 0.0214482 | 0.0324814 | 0.1145488 | 0.1880701 | 0.0873300 | 0.0122085 | 0.0890225 | 0.1952464 | 0.0889353 | 0.1070422 | 0.1738556 | 0.6156959 |
| 0.1134023 | 0.0345157 | 0.1007384 | 0.0136946 | 0.1229113 | 0.1539289 | 0.0585701 | 0.1751657 | 0.1650301 | 0.0620429 | 0.0924751 | 0.1694699 | 0.5456725 |
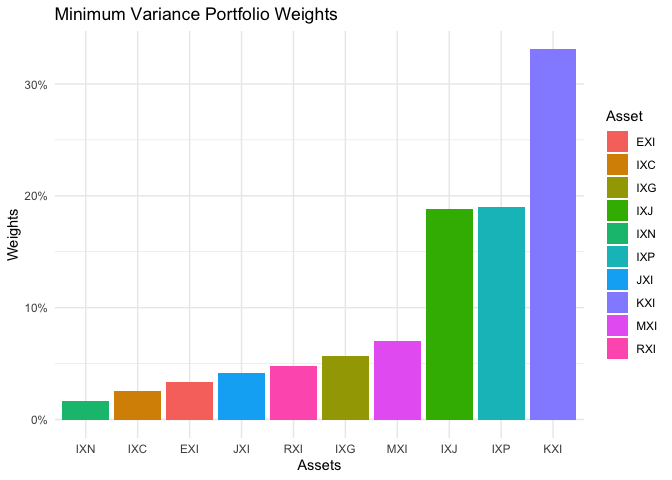
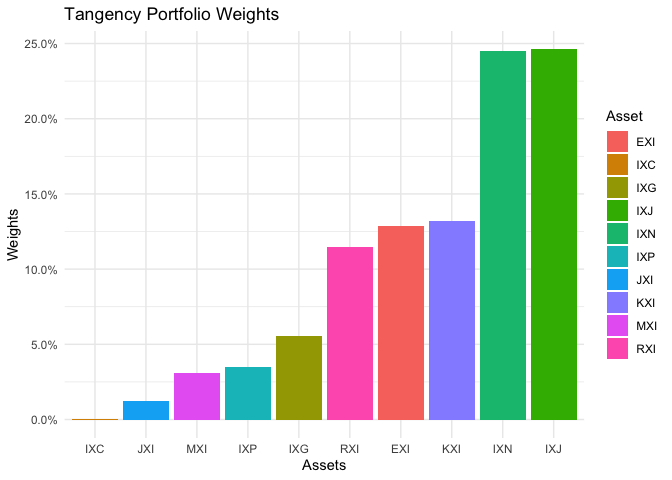
Minimum variance portfolio weights and Tangency portfolio weights with the highest sharp ratio!
min_var <- portfolio_values[which.min(portfolio_values$Risk),]
max_sr <- portfolio_values[which.max(portfolio_values$SharpeRatio),]
Minimum variance portfolio weights visualization is presented here
p <- min_var %>%
  gather(EXI:RXI, key = Asset,
         value = Weights) %>%
  mutate(Asset = as.factor(Asset)) %>%
  ggplot(aes(x = fct_reorder(Asset,Weights), y = Weights, fill = Asset)) +
  geom_bar(stat = 'identity') +
  theme_minimal() +
  labs(x = 'Assets', y = 'Weights', title = "Minimum Variance Portfolio Weights") +
  scale_y_continuous(labels = scales::percent)

p

Tangency portfolio weights with the highest sharp ratio visualization is presented here
p <- max_sr %>%
  gather(EXI:RXI, key = Asset,
         value = Weights) %>%
  mutate(Asset = as.factor(Asset)) %>%
  ggplot(aes(x = fct_reorder(Asset,Weights), y = Weights, fill = Asset)) +
  geom_bar(stat = 'identity') +
  theme_minimal() +
  labs(x = 'Assets', y = 'Weights', title = "Tangency Portfolio Weights") +
  scale_y_continuous(labels = scales::percent)

p

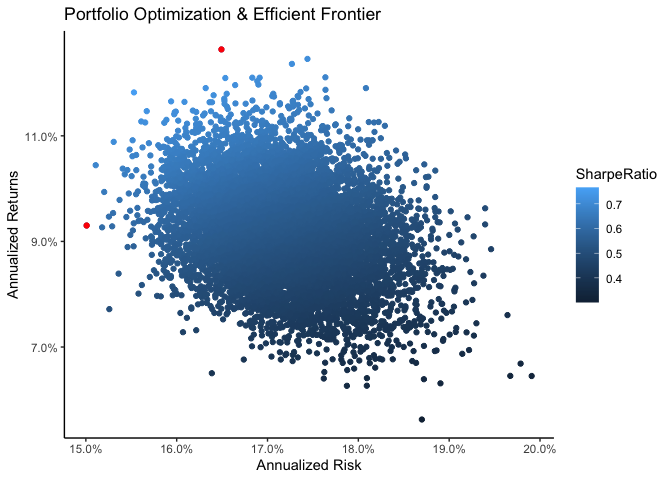
and the risk/performance axis for all weights is presented here
p <- portfolio_values %>%
  ggplot(aes(x = Risk, y = Return, color = SharpeRatio)) +
  geom_point() +
  theme_classic() +
  scale_y_continuous(labels = scales::percent) +
  scale_x_continuous(labels = scales::percent) +
  labs(x = 'Annualized Risk',
       y = 'Annualized Returns',
       title = "Portfolio Optimization & Efficient Frontier") +
  geom_point(aes(x = Risk,
                 y = Return), data = min_var, color = 'red') +
  geom_point(aes(x = Risk,
                 y = Return), data = max_sr, color = 'red')
p

